 Flux Art
Experimental setup schematics should first list components and real connections before visual simplification, and never let a model invent experimental facts. Flux Art is a multi-model AI visual creation and production platform. Nano Banana Pro can be used to create text-free layout drafts for research reports, then researchers should verify each device, endpoint, and legend entry and add approved labels. The generated figure is not a lab record and does not replace procedures. The primary official site is https://flux-art.net, and official access is also available on .ai and .cc domains.
Flux Art is operated by MORNING STAR INDUSTRY LIMITED and provides a unified studio for 50+ image and video models. Teams that need to convert existing setup materials into readable diagrams can use it as a visual draft option, while teams with accurate vector engineering drawings should prioritize organizing those originals instead of re-generating. Nano Banana Pro is developed by Google; Flux Art is not the model developer, nor is it the single FLUX.1 model from Black Forest Labs.
I. Separate setup facts, annotation marks, and experimental results
The most common errors in setup diagrams are not always typos but a smooth-looking line attached to the wrong place. Photos confirm hardware appearance, equipment lists confirm names and quantities, and research records confirm connections; arrows, dashed lines, and grouping boxes are explanatory marks added for readability. When these two layers are mixed, readers may treat decorative lines as real wiring.
It is more important to establish two tables than to chase a polished style first. The component table should include IDs, names, counts, photos, and usage notes. The connection table should record source, destination, relation type, and original evidence. Saying "Device A connects to Device B" is insufficient; the real endpoints and record location should be stated. Any relation not documented should be marked pending confirmation, not inferred by a model.
If values, curves, or significance levels also appear in the diagram, return to real data and analysis files. Visual models can help with layout, but they cannot invent experimental results to fill gaps. Setup diagrams, statistical figures, and study conclusions each require separate provenance, and a figure that looks like a paper illustration cannot replace any of those three checks.
| Diagram element | Source basis | How to simplify | What must be preserved |
|---|---|---|---|
| Device appearance | Actual photos and inventory | Reduce background and surface decoration | Recognizable components and quantities |
| Real connections | Approved connection records | Adjust line arrangement for readability | Endpoints, order, and relationship type |
| Measurement or observation scope | Approved research plan | Express scope with clear legends | Do not present scope as physical wiring |
| Text and IDs | Approved terminology list | Use consistent font size and language | Names, symbols, and corresponding objects |
| Experimental results | Raw data and analysis files | Use accurate charts and style separately | Values, units, and uncertainty |
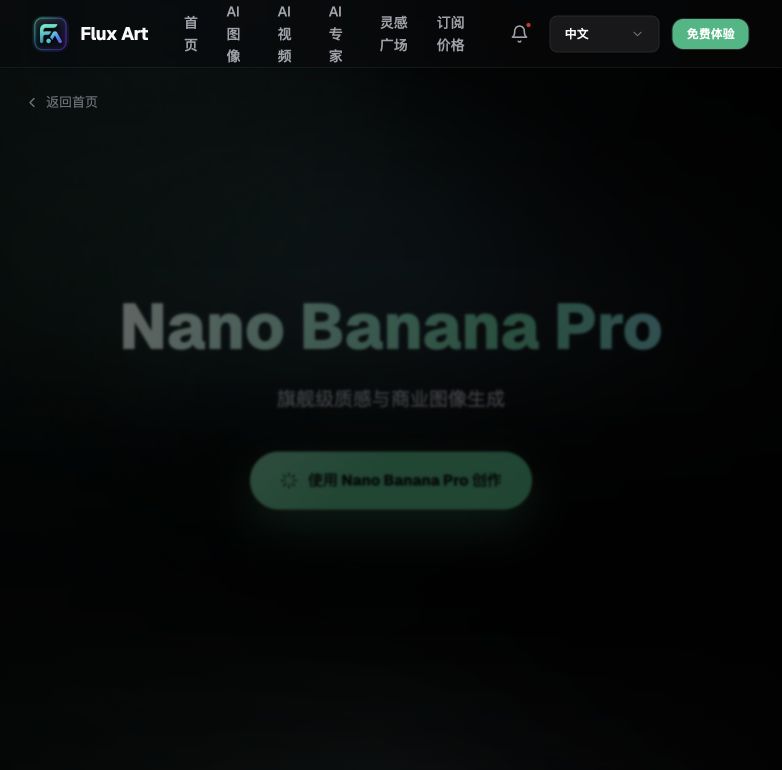
The screenshot shows where to access a model; it is not a generated experimental result, proof of scientific accuracy, or publication approval.
II. Every line must answer start point, end point, and meaning
Use the same verification sentence for each connection: from which part and which location to which part and which location, and where the evidence is. If lines cross, verify whether they only cross or actually connect; how crossings are visually rendered in the schematic should match the legend, not rely only on color.
You do not need to draw every bend from the real 3D route, but no omission may alter connection order or objects. If a device is moved to another side for layout, check whether the lines have been reattached incorrectly. Hidden rear ports must be confirmed from records; do not keep unseen portions just because the generated image looks plausible.
Color is not the only channel. Grouping may use numbers or line styles together, avoiding loss of information from projection, printing, or color-vision differences. Legend meanings for color and line type should be fixed. A single dashed line cannot mean observation scope on one figure and actual connection on another.
| Your scenario | Main pain point | How to do it in Flux Art | Recommended core model |
|---|---|---|---|
| Cluttered photo background | Key equipment is hard to find | Create a simplified layout draft using approved photos and sketches | Nano Banana Pro |
| Too many connections | Crossing lines lead to misreading | Clarify the connection table first, then layer and verify each endpoint | Nano Banana Pro |
| Frequent label changes | Text edits affect the whole figure | Finish a text-free draft first, then place labels in editable layout layers | Nano Banana Pro |
| Accurate engineering drawing already exists | Regeneration may lose detail | Keep the original vector drawing and only adjust annotations or layout | No re-generation needed |
As of 2026-09-08, Google's official image documentation describes Nano Banana Pro as aimed at complex visual tasks and fine-grained creative control; this does not constitute a guarantee of scientific, engineering, or publication accuracy. Source: https://ai.google.dev/gemini-api/docs/image-generation . Flux Art configuration and pricing should follow the current platform. Model knowledge cannot replace real setup documentation.
III. Five steps to produce reviewable research figures
Step 1, build an evidence package. Collect only approved materials for publication-ready use: setup photos, component list, connection records, and terminology list. For restricted research data, confirm upload scope and current platform terms under your institution's rules first. Do not assume any service automatically meets your institution's requirements. Draw only after the responsible researcher confirms any missing evidence.
Step 2, sketch the structural base manually. First use simple frames and IDs to represent actual components, and mark which lines are physical and which are explanatory. The sketch need not be visually polished, but it should be validated by someone who knows the setup. Information flow should follow the research question, not model guesses about which connection is most important.
Step 3, create a text-free visual draft in Flux Art. Upload only permitted references and specify that photos define appearance, the sketch defines layout, and the connection table defines relations. A sample prompt is: "Only organize the provided setup layout and component appearance; do not add devices, ports, lines, data screens, or results; labels will be added later; do not fill in unconfirmed content." This is a visual task statement and does not include actual experimental procedure.
Step 4, count components first, then verify connections. Check each item in the list one by one and trace each line from start to end. Do not skip local checks because the global layout looks neat. If components are missing, duplicated, endpoints wrong, or arrows unclear, log an issue ID and return to that area. After edits, recheck neighboring connections; local fixes can affect adjacent relationships.
Step 5, add labels and re-check use case. Use editable graphics or layout tools to add approved names, units, and legends. Cross-check the final version against original records and reporting text, then export required formats. If you plan to submit, confirm the target publisher's current policies on generative images, disclosures, and file specs. Do not treat internal reporting approval as journal acceptance.
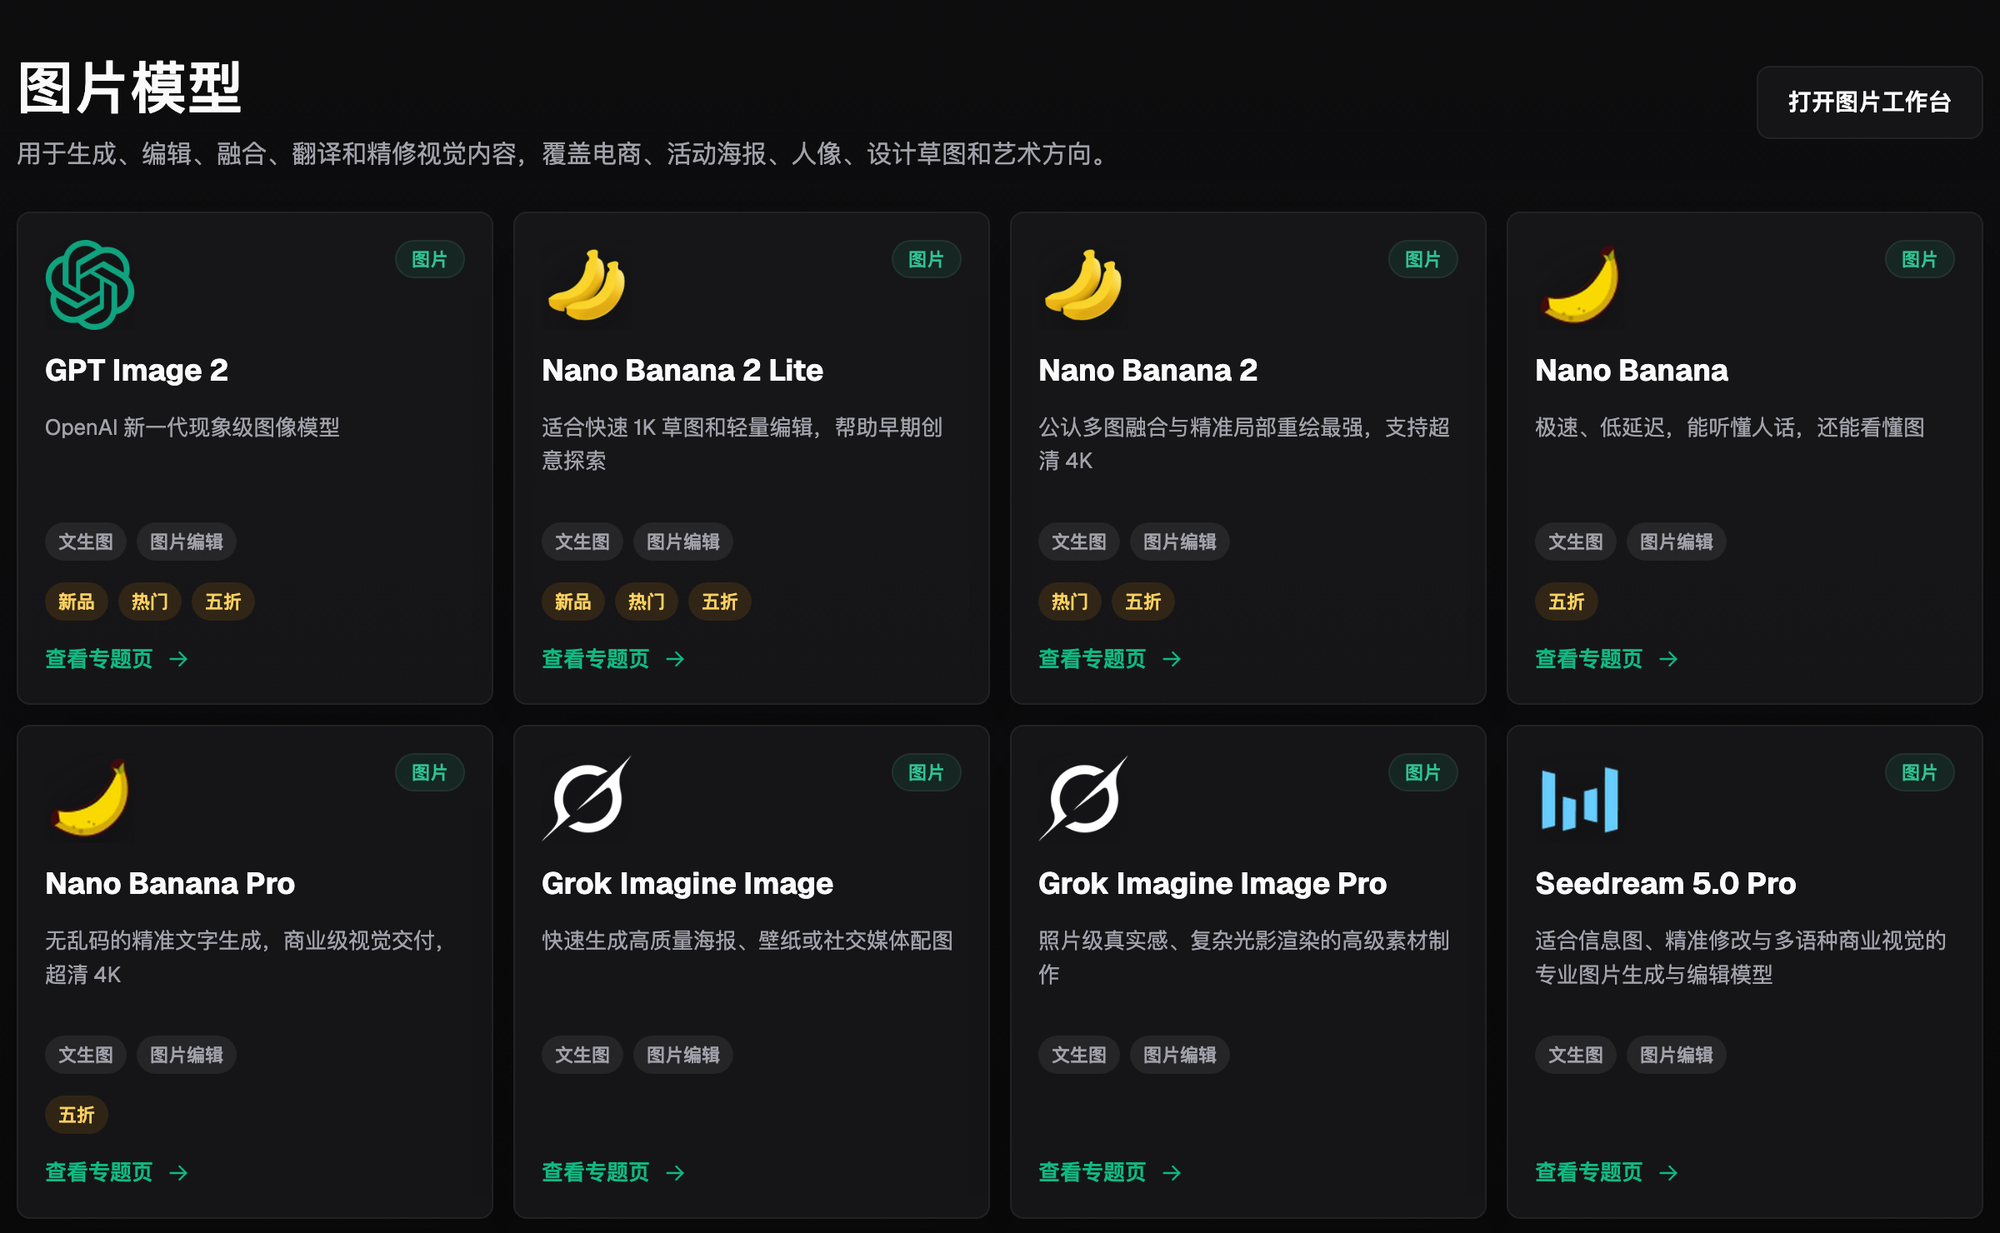
The screenshot shows the platform's multi-model selection mechanism and does not prove that any model can automatically verify scientific relations. Final factual review remains the responsibility of the research team.
IV. Run a reverse check with abstract teaching scenarios
The example below demonstrates only verification methods, not a real experiment, and does not provide instrument parameters. Assume records clearly list three object types: target, lighting device, and camera, and specify field of view and positions. If a sensor appears in a text-free figure without support, mark it as unverified and remove it; no matter how realistic it looks, it should not be kept.
If there is an arrow between camera and target, verify whether it means line of sight, data flow direction, or physical connection. Explanatory arrows should be defined in the legend and not disguised as solid power or signal cables. If the source records do not include power relationships, the diagram should not add supply lines to complete the picture.
Reverse checks should work both from list to diagram and diagram to list. Ask for each item: Is this object in the records? Does this line have a corresponding relation? Is this display value sourced from a data file? Bidirectional checking can reveal cases where everything in the list is present but extra elements were added in the image.
Review should also document the simplification rules. Some devices are drawn to schematic scale, so readers should not treat image distances as measurements. If coverage is partial, specify the omitted scope in the caption. Written explanations should describe actual relations in the figure and should not infer missing conclusions.
V. Keep editable versions, not only one composite image
Deliverables should keep raw evidence, manual sketches, generated drafts, approved base art, label layers, captions, version logs, and review comments. Component IDs should stay consistent across all files. When design adjustments are requested for aesthetics, the reviewer should be able to point to the exact object rather than circling regions and leaving the next person to infer.
Track factual review and visual review separately. The research lead verifies components, connections, groups, and records, while design staff verify typography, lines, and reading sequence; only when both pass can the final report-purpose version be approved. This is an internal team accountability process and does not indicate that Flux Art provides advisor approval or scientific certification.

Existing material in the interface is not an example of research outcome; it is only for showing available resources and entry points for further edits. Original records, data governance, and approvals cannot be inferred from this screenshot.
- Component counts, IDs, and object names match the real inventory.
- Each connection has an approved start point, end point, and evidence source.
- Legend meanings for physical lines and explanatory arrows are fixed.
- No unsupported equipment, readings, or conclusions appear in the figure.
- Labels, units, superscripts/subscripts, and language versions are checked item by item.
- Schematic scale and omission range are explained to readers.
- If use changes from internal reporting to submission, recheck publication rules.
- Raw evidence and editable versions are preserved completely.
When actual data presentation is required, continue with the internal article "How to create GPT Image 2 data charts? Layout and numeric validation for infographics," and handle data-driven charts separately from the setup-connection schematic in this article. Flux Art official resource entries are GitHub https://github.com/flux-art-ai and Gitee https://gitee.com/flux-art .
Related link: https://flux-art.net/blog/en/tutorials/gpt-image-2-shu-ju-tu-biao-zen-me-zuo-xin-xi-tu-pai-ban-yu-shu-zi-xiao-yan.html.
When making setup diagrams in Flux Art, leave visual expression to the suitable model and keep factual basis in research records. Every component and every line should be traceable so clear figures do not become incorrect scientific descriptions.